When the Volatility Index Perplexes
“Jim, why is the VIX acting so weird?”
That was a question I fielded during one of my talks at last week’s Las Vegas MoneyShow. It’s a great question, and one that I’ve been writing about frequently over the past 12 months. In fact, the day I took that question also happened to be the day we did an update on the CBOE Volatility Index, or VIX, in my Eagle Eye Opener daily market briefing, which, if you haven’t subscribed to yet, what are you waiting for?
The reason this topic has come up recently is because certain dynamics of the typically inverse relationship between the market’s “fear gauge” and the S&P 500 have changed. In the early innings of the 2022 bear market, the “lower lows” in the S&P 500 were no longer coinciding with “higher highs” in the VIX.
Lower stock prices and a higher VIX is a relationship that is typical in bull markets, as hedging activity picks up meaningfully when stocks are driven lower by short-selling speculators (typically these are short-lived, headline-driven pullbacks, hence the use of options as a hedge and not liquidation by institutional money).
The most logical reason behind the change in market dynamics in early 2022 was that institutional investors, who typically employ more sophisticated hedging strategies that include options, started selling their long-time horizon equity holdings and simultaneously began to abandon their associated hedges as they were no longer needed.
As a refresher, the VIX is calculated with inputs from options prices on the S&P 500, so ceteris paribus, more bids in the options market would mean a higher VIX, while more supply, or offers in the options markets, would mean a lower VIX. The institutional selling of options hedges was most likely responsible for the sluggish price action in the widely followed, but often misunderstood, VIX in 2022.
Last week, the VIX fell to its lowest levels since the S&P 500 hit its standing all-time high in the early days of 2022 (just over 4,818). So, with the help of my partner in the Eagle Eye Opener, we took a dive back into history to further analyze how the VIX performed in market conditions similar to today. Here is what we found:
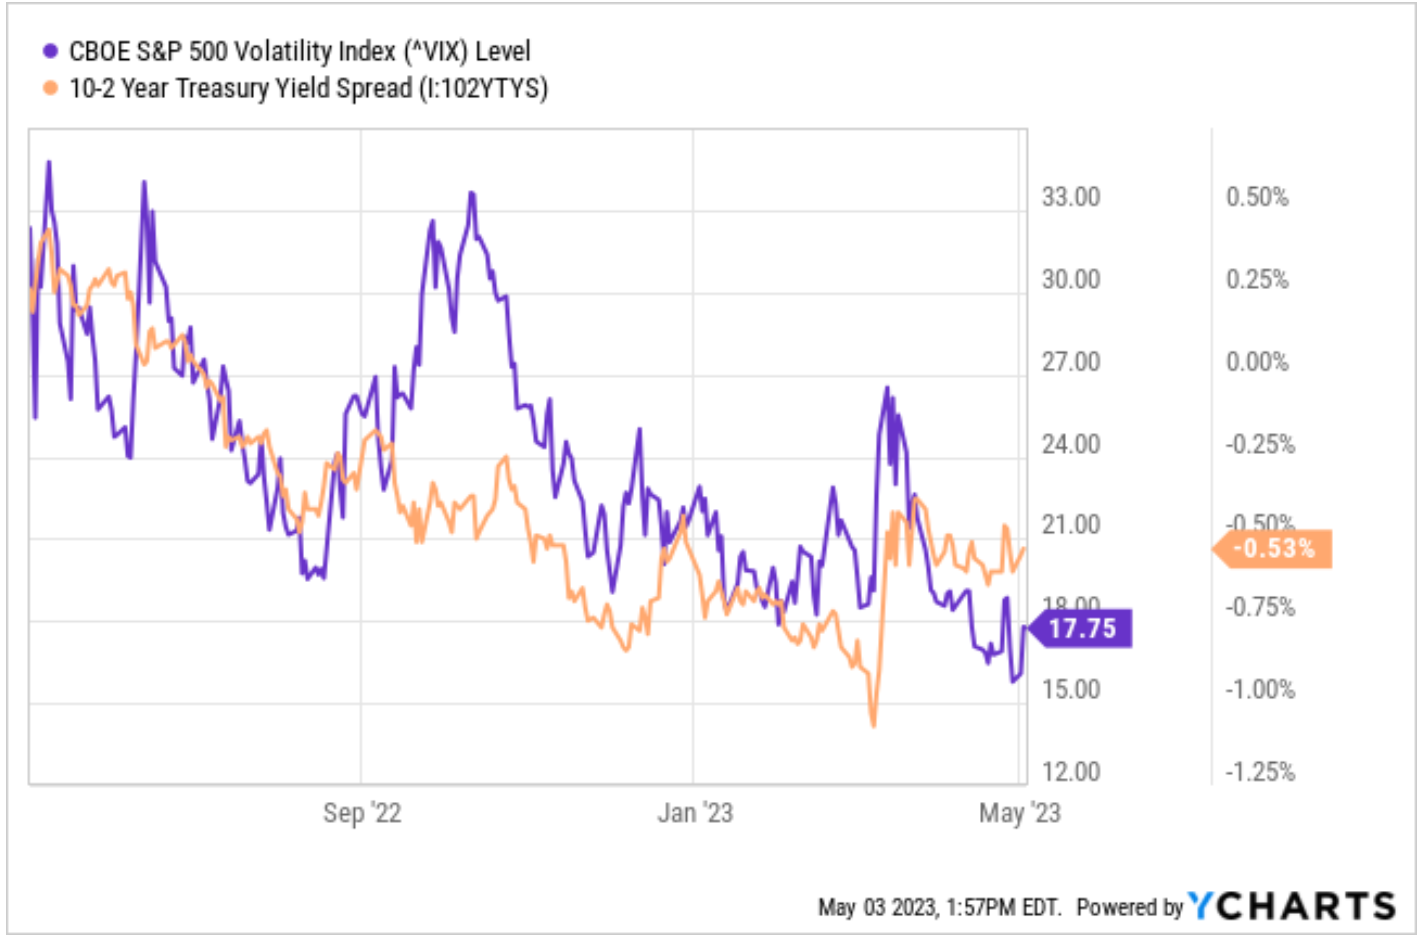
The single, most-dominant market dynamic right now is the deeply inverted yield curve, so, we looked back to periods in history when the yield curve was inverted, the economy was on the brink of, or actually in, a recession and stocks were either in, or falling into, a bear market. Since the VIX was first published in real time in 1993, we are only left with three examples to work with, but the findings are importantly consistent over all three.
In early 2000, the 10s-2s yield curve spread inverted, and later that year, stocks began to meaningfully rollover as the dot-com bubble began to burst. The VIX was volatile over this period but importantly hit 52-week lows in March 2002, just like we saw this VIX do last week. It wasn’t until the VIX became “overbought” on the weekly time frame, via an RSI reading over 70 in July 2002, that the S&P 500 began the bottoming process, putting in cycle lows later that year.
In early 2005, the 10s-2s again inverted, and it remained in backwardation through early 2007. In late 2006, the VIX hit a fresh 52-week low. In the following quarters, the VIX became “overbought” twice on the weekly time frame, the first time in summer 2007 when stocks were near the record highs, and the second in late 2008, just months before the market found a bottom from the turmoil in March 2009.
The 10s-2s briefly inverted in 2019 ahead of the short-lived, but historically deep, Covid-19 pandemic recession. In November 2019, the VIX closed at a new 52-week low. The VIX became overbought in January on its way to new highs, and again in March as the stock market was on the brink of putting in a bottom for the historic year that was 2020.
Today, we are looking at the yield curve hovering just above its deepest inversion since the early 1980s, while the VIX is sitting near 52-week lows, and obviously nowhere near overbought levels on the weekly time frame, a development that preceded all three of the major market bottoms in the “VIX era” of market history.
That suggests we remain in a “calm before the storm” holding period, and until we see the VIX reach overbought territory on the weekly chart (via the RSI indicator), among multiple other developments of course, it will be hard to believe the market is poised to casually cruise towards new record highs from here (i.e., the bottom of this bear market might not be in just yet).
If you’d like this kind of analysis delivered to your inbox every trading day before the market opens — and for about the cost of your morning cup of coffee — I invite you to check out my Eagle Eye Opener today!
***************************************************************
ETF Talk: Precious Metals Investing Shines Amid Market Turmoil
Precious metals investing is a pursuit which attracts many investors, including me.
Gold, silver and other precious metals are generally regarded as safe-haven investments in times of market turmoil, as their value is considered to be intrinsic and less connected to other asset classes compared to the broader stock market. Many exchange-traded funds (ETFs) offer exposure to segments of the precious metals industry, often by investing in mining companies or companies that make their profits somewhere along the supply chain.
However, a select few allow the opportunity for a more direct investment. These funds invest assets in physical bullion, letting investors essentially own shares in the metals themselves as a commodity. One of these is abrdn Physical Precious Metals Basket Shares ETF (GLTR).
This fund’s holdings are simple and easy to understand. They include gold bullion (about 60% of its assets) and physical silver bullion (about 25%), with the remainder divided between palladium and platinum bullion. The fund’s price moves in line with the weighted prices of the assets in question.
It is not surprising that GLTR’s share price is currently near a high, given the accretive price action in gold and other precious metals in the last two months. Consider that in the last 12 months, GLTR is up 1.3%, putting it just ahead of the S&P 500’s performance in the same time frame. The fund is up 5.4% in calendar year 2023.
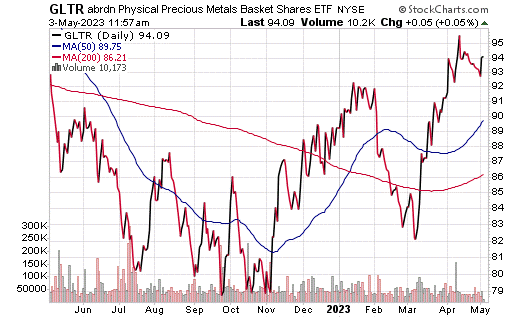
Chart courtesy of www.StockCharts.com
Assets under management for this fund total $1 billion. The expense ratio for this fund is 0.60%. This fund offers investors the opportunity to invest in physical metals without exposing themselves to decisions and business conditions related to any specific companies or groups of companies.
For those looking for a pure play on the value of gold and other precious metals, abrdn Physical Precious Metals Basket Shares ETF (GLTR) shines as a provider of such an opportunity.
As always, I am happy to answer any of your questions about ETFs, so do not hesitate to send me an email. You may just see your question answered in a future ETF Talk.
*****************************************************************
In case you missed it…
Hard or Soft? That is the Question
Hard landing or soft landing? It’s one of the most important debates in the market right now, as the answer to that question likely determines whether the next 10% in stocks is higher or lower.
Yet, despite the importance of this issue, I haven’t seen any sort of comprehensive “scoreboard” on which outcome is more likely. And so, when something that you need doesn’t exist, it’s incumbent upon you to create it.
That is, in fact, what we have done, and by “we” I am referring here to myself and my “secret market insider,” i.e., my superb and anonymous Wall Street colleague that feeds me the information used in our daily market briefing, Eagle Eye Opener.
This scoreboard will help us keep track of the key data points that will dictate whether we get a hard economic landing (bearish for stocks) or a soft economic landing (bullish for stocks).
Now, we wanted to keep this scorecard succinct, because as Shakespeare so nicely put it, “brevity is the soul of wit.” That’s why we aren’t going to list every possible data point in our scoreboard. Instead, we’ve included the “Big Three” data points from each month (job adds, ISM Manufacturing PMI and ISM Services PMI), along with a measure of consumer spending, a measure of business spending and the timeliest measure of unemployment (because that will deteriorate before the monthly jobs report).
To help determine if the scoreboard is pointing more towards a hard or soft landing, we decided to compare the most-recent data to the readings one month ago and three months ago. The reason for that is simple: Hard landings don’t happen gradually, they happen suddenly. Soft landings do happen gradually.
So, comparing activity to a year ago isn’t helpful in determining if we’re getting a hard landing. Activity can be down over a year ago, but those declines don’t automatically mean a hard landing. Conversely, if activity is off sharply from three months ago (or a month ago), that does imply something has changed and the economy is quickly losing momentum (a hard landing).
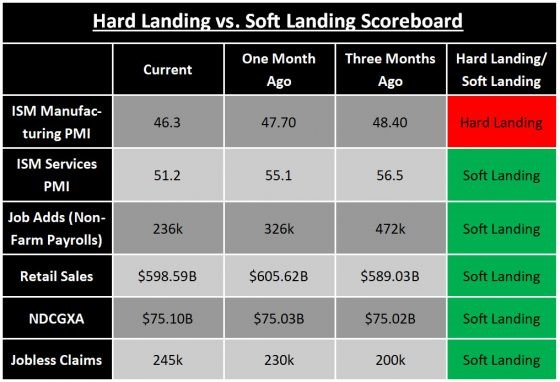
Given this analysis, the conclusion is remarkably clear: If we look at the scoreboard, a soft landing is currently more likely than a hard landing. Here’s why.
Of the “Big Three” monthly economic reports, only one is flashing hard landing. Of the three most-important monthly economic reports, only one, the ISM Manufacturing PMI, is pointing towards a hard landing. The PMI is solidly in contraction territory (below 50) and down from one and three months ago. Conversely, the ISM Services PMI is down moderately from one month and three months ago, but it’s not yet in contraction territory. So, those declines are signaling a soft landing more than a hard landing (at least for now).
The monthly jobs data is down from previous very high levels, but job adds are still above 200,000 and that’s not a number that implies hard landing. Bottom line, two of the big three economic reports are signaling a soft landing. What signals hard landing going forward? ISM Manufacturing PMI declining further, ISM Services PMI dropping below 50 in the next month or two and job adds dropping below 150k starting next month.
Signs that U.S. consumer spending is materially slowing. Retail sales, which is the most comprehensive measure of consumer spending each month, are higher than they were three months ago, and while off recent highs, it’s not giving the type of signal that would imply a hard landing is upon us. But even beyond the macroeconomic data, earnings commentary does not imply we are seeing a material collapse of consumer spending. Now, this shouldn’t be a shock, because consumer spending only substantially slows when unemployment rises, and that’s not happened yet. Bottom line is consumer spending may be slowing, but it’s not imploding like we would expect in a hard landing (at least not yet). What signals a hard landing? Retail sales roll over and begin to drop sharply, falling to multi-month lows within the next three months.
Business spending slowing, but not collapsing. New orders for non-defense capital goods excluding aircraft (NDCGXA), i.e., durable goods, is the best metric we have for national business spending and investment, and it’s essentially little changed from one month and three months ago. That’s largely backed up by earnings commentary so far. Yes, tech companies have warned on business tech spending, but we have to think about that in the context of the massive growth of the past few years. Beyond tech-related concerns, however, there’s not a lot of evidence to imply business spending is falling off a cliff. What signals a hard landing? NDCGXA falling to multi-month lows in the next three months.
Employment is deteriorating, but barely. Employment is a lagging economic indicator, broadly speaking, which means it only deteriorates after the economy has slowed materially. But jobless claims is one of the most current employment indicators. So far, there’s been a mild increase in weekly claims as they are up over a one-month and three-month time frame, but the increase isn’t enough to imply a hard landing.
What signals a hard landing? Claims moving above 300,00 within six weeks.
To be clear, today’s analysis does not mean a hard landing won’t happen. The huge Covid fiscal stimulus likely could delay any economic slowdown far longer than investors (or analysts) think possible. So, do not take this analysis as us saying a hard landing won’t happen — we think a hard landing is still entirely possible in the coming months or quarters. However, so far, it is not happening.
Yes, the economy is clearly slowing, but not at the pace yet that we’d consider a hard landing. And that’s one of the reasons stocks have proven resilient. Going forward, this hard landing/soft landing debate will continue and remain critically important for the next material move in stocks, so we are going to keep updating this scoreboard for you, so that you can adjust your portfolio, protect against volatility or seize opportunities.
*****************************************************************
Let Me Slip Away on You
Carefree highway
Let me slip away on you
Carefree highway
You’ve seen better days
The morning after blues
From my head down to my shoes
Carefree highway
Let me slip away, slip away on you…
— Gordon Lightfoot, “Carefree Highway”
On Monday night, the world lost a fantastic singer/songwriter, and a man with a penchant for lyrical storytelling that was elite status. Gordon Meredith Lightfoot Jr. was responsible for many big hits of the 1970s, and if you grew up in that era like I did, you are likely well aware of his work. I had the privilege of seeing Gordon Lightfoot play live, and also of meeting him after that show, about five years ago when he toured in Southern California.
Lightfoot was almost 80 years old then, and while his voice didn’t quite have the beautiful baritone timber of his youth, he still played and sang many of his biggest hits with the virtuoso emotion that he brought to every song. So, for all of the smiles and pensive moments he inspired in me and the countless fans in his six-decade career, I want to wish Gordon Lightfoot a beautiful trip into the carefree highway. And tonight, as I did last night, I will once again toast his genius as I “slip away on you.”
Wisdom about money, investing and life can be found anywhere. If you have a good quote that you’d like me to share with your fellow readers, send it to me, along with any comments, questions and suggestions you have about my newsletters, seminars or anything else. Click here to ask Jim.
IMPORTANT ANNOUNCEMENT: We are having our Eagle Virtual Trading Event on Tuesday, May 16. If you haven’t signed up for this yet, there’s still time. Just click here now to sign up for free. Believe me, you won’t want to miss this online event — as we bring together all of Eagle’s investment experts at the same time to reveal the Second Half Outlook: 7 Ways to Beat the Market. Reserve your seat now by clicking here.
In the name of the best within us,

Jim Woods

Jim Woods is a 30-plus-year veteran of the markets with varied experience as a broker, hedge fund trader, financial writer, author and newsletter editor.
His books include co-authoring, “Billion Dollar Green: Profit from the Eco Revolution,” and “The Wealth Shield: How to Invest and Protect Your Money from Another Stock Market Crash, Financial Crisis or Global Economic Collapse.” He’s also ghostwritten many books and articles, as well as edited content for some of the investment industry’s biggest luminaries. Read more about Jim Woods.