He Eat a Lot of Ice Cream
When asked in an interview on “Meet the Press” if he could name one thing that President Biden has done that he supports, Georgia Senate candidate Herschel Walker uttered the following response…
“He eat a lot of ice cream.”
Walker’s bid for the Senate, which includes the endorsement of former President Trump, has been highly controversial for many reasons that you’ve likely heard about already.
I am going to leave those issues for another discussion, because today I want to point out the relationship President Biden has with ice cream — a relationship I’ve had first-hand knowledge of since before he was even vice president.
In fact, the Walker comment got me reminiscing about one of the most interesting airplane journeys I’ve ever been on, courtesy of the then-Senator from Delaware.
So today, I bring you my recollections from that episode, which have appeared before in this column and that were originally written in August 2008. And given the recent Walker comment, I think these thoughts are once again all too timely.
We All Scream for Ice Cream: A Joe Biden Tale
You can tell a lot about a man by the way he eats.
Some men like to sit down to a meal, take their time and savor each and every morsel of food and drink. People like this tend to be thoughtful, meticulous, confident and in many cases, hedonistic. How do I know this? Well, I’ve been known to spend more time than most getting through a multi-course, wine-paired meal.
Still, other men like to dig right into their prize, attacking the meal with fervor and a literal hunger for life that reveals their carpe-diem approach to the world. This type of person tends to be decisive, purposeful, driven and a born leader. My favorite example of this type of eater is my good friend and fellow investment guru Doug Fabian.
But what do you say about a man who eats his meal in reverse order?
That thought has plagued me ever since I sat next to Sen. Joe Biden on a flight from Washington, D.C. to my hometown of Los Angeles, California. Sen. Biden was on his way to L.A. for an appearance on HBO’s “Real Time with Bill Maher,” while I was returning home from my annual pilgrimage to the nation’s capital for a meeting with friends, publishers and people from some of my favorite think tanks.
After exchanging pleasantries with the senior senator from Delaware, Biden wasted no time in digging right into his criticisms of the war in Iraq, and what he perceived to be the folly of the Bush administration. I expected nothing less from the senator, as he’s known for his outspoken critiques and his shoot-from-the-hip commentary.
What I didn’t expect was a lesson in how to eat a meal backwards.
Now, since I had the benefit of first-class seating accommodations during this journey, the flight attendants were very conscientious when it came to serving what was a surprisingly tasty meal. The first course was a salad with Italian dressing, which was followed by a main course of a plump, well-seasoned chicken breast and a side of rice. The best part of the meal for me was the dessert, which was a generous scoop of gourmet chocolate ice cream.
I ate my meal with my usual casualness, and in the aforementioned order. Sen. Biden, however, took a different path. Biden accepted the salad, but he put it aside and saved it for later. When the main course came, he politely rejected it. But when the ice cream came, Biden’s fervent personality really came out. He emphatically asked for a serving, although he had not yet eaten any food.
Biden ate his ice cream while we discussed Kevin Phillips’ book “American Theocracy,” the then-latest critique of the Bush administration’s religious overtones. After eating the ice cream, Biden pulled out a hefty ham sandwich from his briefcase and consumed it in a deliberate and determined fashion. Once the sandwich disappeared, the senator turned to the only remaining bit of food left on his tray table, the salad.
As I watched this reverse-order meal consumption, a thought occurred to me: Is this why the federal government is so screwed up? Is Sen. Biden’s backwards approach to a meal indicative of what’s wrong with Washington? Does this backwards eating pattern explain why the government does everything less efficiently and less effectively than the private sector?
Given my theories on discerning knowledge of a person based on how they eat, what was I to make of Sen. Biden’s meal habits? The only logical conclusion is that Biden looks at the world — shall we say — differently from the rest of us. And while there is nothing wrong with a little different perspective on things, I don’t think I want someone a heartbeat away from the presidency who eats his ice cream first.
The next thing you know is that person will advocate raising taxes to stimulate the economy, negotiate with our ideological enemies as a means of portraying strength and railing against judges who think interpreting the Constitution is the only proper function of the courts.
Wait a second… that’s what Biden wants?
I knew there was a reason why he ate the ice cream first.
***************************************************************
ETF Talk: Betting Big with the ProShares Short Russell2000 ETF (RWM)
Much like last week’s featured exchanged-traded fund (ETF) in The Deep Woods, the ProShares Short Russell2000 ETF (RWM) provides a bet against the Russell 2000’s index of 2,000 U.S. small-cap firms, the majority of which are growth and value stocks.
The underlying index, the Russell 2000, specifically contains the 1,001st through the 3,000th securities of the Russell 3000, which covers approximately 10% of its total market capitalization. RWM’s portfolio encompasses securities across a broad range of sectors and industries with no bias and, once the security and industry groups are chosen, they are then weighted by market cap.
To achieve the desired inverse exposure, RWM uses both ETF and index swaps. The ProShares Short Russell2000 ETF is a levered product and resets daily. As such, RWM is not a buy-and-hold fund and therefore should not be expected to approximate an inverse leverage return beyond a one-day period.
The fund, established in 2007, has $589.3 million in assets under management. As is visible from the chart below, its performance does have its share of dips. Its spikes are just as strong, if not stronger.
After a sharp dip in early August, the fund has more than recovered and is close to the high end of its 52-week range, which is $27.14 per share. Currently, RWM is trading around $25.11, up 0.9% from its open and off only about two points from its 52-week range high.

Courtesy of Stockcharts.com
As RWM provides a bet against the Russell 2000’s index, its nine top holdings include Russell 2000 Index Swap Bank Of America Na, 25.17%; Russell 2000 Index Swap Citibank Na, 22.24%; Russell 2000 Index Swap Bnp Paribas, 13.13%; Russell 2000 Index Swap Goldman Sachs International, 9.74%; Russell 2000 Index Swap Ubs Ag, 7.31; Russell 2000 Index Swap Societe Generale, 6.52%; United States Treasury Bills, 6.22%; Russell 2000 Index Swap Morgan Stanley & Co. International Plc, 6.07% and E-mini Russell 2000 Index Future June 21 (RTYM21), 6.03%.
Once again, RWM is a levered product and not a buy-and-hold fund. For investors looking to add an ETF that will mature over time, this may not be the right fund, as it should not be expected to provide an approximate inverse leverage return beyond a one-day period.
So, interested investors should always conduct their own due diligence in deciding whether the fund is suitable for their own individual investing goals.
As always, I am happy to answer any of your questions about ETFs, so do not hesitate to send me an email. You just may see your question answered in a future ETF Talk.
*****************************************************************
Wednesday Wisdom
Wednesdays mean wisdom, and that’s especially true at my podcast and lifestyle website, Way of the Renaissance Man.

This week’s wisdom comes to us courtesy of American statesman, diplomat, Founding Father and the fourth President of the United States, James Madison.
The insightful Madison warned us that if tyranny and oppression ever come to America, it will be in the guise of fighting a foreign enemy.
For the complete dose of Madison’s brilliance, check out the newly published Wednesday Wisdom featured right now at Way of the Renaissance Man.
*****************************************************************
In case you missed it…
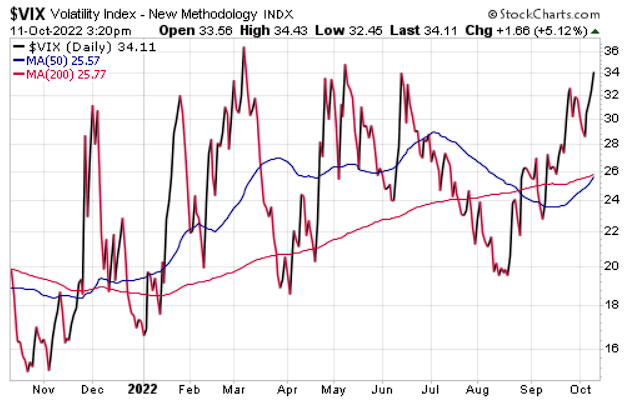
What’s Going On with the ‘VIX’?
There are a lot of indicators to watch in the market. There are moving averages, price-to-earnings ratios, relative strength ratings, earnings per share (EPS) growth rates, stochastics, Bollinger bands — and even something called a Fibonacci.
While most market indicators are useful in their context, sometimes there are indicators that give off a perplexing warning sign that becomes an interesting metric to track during a potential market pivot. Today, that indicator is the market dynamic that is the historical inverse correlation between the broader stock market (S&P 500 Index) and the CBOE Volatility Index (VIX).
The following analysis of the VIX appeared Tuesday morning in the inbox of subscribers to my Eagle Eye Opener daily market briefing. Here, my “secret market insider” provided us with this deep dive into what the VIX is telling us right now. So, if you want this kind of insight sent to you each morning at 8 a.m. Eastern, then you must subscribe to Eagle Eye Opener today!
Since markets bottomed in March 2009, the S&P 500 and the VIX have consistently maintained an inverse correlation, with the volatility index typically drifting steadily lower as equities powered to new highs (think 2017, when the VIX fell into single digits amid steady stock market gains) while bouts of volatility and short-lived selloffs in the stock market saw the VIX spike higher. Digging into this relationship deeper, when stocks made new meaningful lows below notable support levels, the VIX would almost always rise to new highs beyond those that corresponded with the previous lows in stocks.
For example, as the S&P 500 dropped below the lows from late 2018 (2,346) during the Q1 ’20 COVID-19-crash, which carried the index down to 2,191, the VIX blasted through the late-2018 high of 36.20 and peaked at a staggering 85.47. The uncertainty associated with the first pandemic in 100 years certainly amplified the move higher in the VIX in that example, but it does illustrate the point of the traditional inverse correlation between stocks and the VIX very well.
Now, the actual formula and process used to calculate the VIX is very complex and involves some high-level math, but in the simplest terms, the index measures price activity, mainly demand, in the options market. That is why in normal market conditions, the VIX rises amid increasing demand for puts as the broader stock market declines, and this also is the reason it is often referred to as the markets “fear gauge.”
When “smart money” is adding hedges to long equity positions to limit drawdowns and reduce portfolio risk, the VIX rises with the increasing demand in the options market. This occurs regularly during periods of volatility in secular bull markets, as investors prefer to avoid selling positions outright for tax reasons.
In normal bull markets, new lows in the S&P 500 are almost always met with new highs in the VIX (with a few outlier exceptions such as the “VIX-mageddon” event in early 2018). As the market recovers and smart money reduces those hedges, the VIX tends to retreat, often quite rapidly.
But at both of the most recent major market peaks that occurred in 2000 and then again in 2007/2008, that historically consistent inverse correlation between the stock market and the VIX broke down as new meaningful lows in the S&P 500 were not met with new highs in the VIX. And it has happened again this year.
The logical question to ask here is: why would this happen?
At first glance, it makes no sense as to why a widely followed, broad-market volatility indicator would just suddenly stop functioning as it has for the last decade. However, as we have noted over the course of the year, there is a likely explanation for making sense of a breakdown in the relationship between the S&P 500 and the VIX.
As stocks make new meaningful lows, as they first did in February, then again in May and June of this year, we believe sophisticated investors were actually liquidating long-term, long equity positions as opposed to holding those positions and just adding hedges to manage risk and downside exposure as was discussed above. When there is “real” selling and liquidation going on by sophisticated investors, most of them are also unwinding hedges, which, in its simplest form, means the net selling of put protection (although some hedging strategies are very complex and go well beyond simply holding single strike puts) and therefore keeping pressure on the VIX per its complex calculation of demand for options.
So, what we are seeing in cross-asset analysis with the VIX and the S&P 500 right now is the same thing we saw in both 2000/2001 and 2007/2008 in the early stages of those respective bear markets. And the bad news is that this dynamic only persists during the “distribution phase” of market cycles when sophisticated investors are liquidating to retail investors attempting to “buy one more dip.” Once the VIX finally breaks the downtrend of “lower highs” and begins to move meaningfully higher, the real breakdown and capitulation in stocks begins.
Looking at the dot-com bubble, the downtrend in the VIX was broken in September 2001, and the S&P 500 proceeded to decline another 30% or so, as the VIX ripped higher, before finally bottoming in late 2002. During the financial crisis, the VIX downtrend was not broken until September 2008, and the S&P 500 fell another 47% to the March 2009 lows (of course, the VIX ripped higher as well).
Fast-forward to 2022 and once again, September saw the VIX break through multiple significant downtrend lines, suggesting we may be on the cusp of the final capitulation phase of this bear market cycle. There is no way to confidently forecast how far stocks could fall from current levels but using the last two major bear markets as a guide suggests that additional losses could be significant.
On the charts, now that the longstanding downtrends in the VIX have been broken, the critical level to watch is the June high of 35.05. A break above there would very likely signal significant pain (borrowing the term from Federal Reserve Chairman Powell) looming in the equity markets.
*****************************************************************
The Ingenuity of Fools
“A common mistake that people make when trying to design something completely foolproof is to underestimate the ingenuity of complete fools.”
— Douglas Adams
The brilliant author, most well-known for his irreverent, insightful and highly recommended humor-laced science fiction works, “The Complete Hitchhiker’s Guide to the Galaxy,” reminds us that foolishness is rampant throughout the galaxy. So, when you’re making plans, tailor those plans to the thoroughbreds, not the donkeys.
Wisdom about money, investing and life can be found anywhere. If you have a good quote that you’d like me to share with your fellow readers, send it to me, along with any comments, questions and suggestions you have about my newsletters, seminars or anything else. Click here to ask Jim.

Jim Woods is a 30-plus-year veteran of the markets with varied experience as a broker, hedge fund trader, financial writer, author and newsletter editor.
His books include co-authoring, “Billion Dollar Green: Profit from the Eco Revolution,” and “The Wealth Shield: How to Invest and Protect Your Money from Another Stock Market Crash, Financial Crisis or Global Economic Collapse.” He’s also ghostwritten many books and articles, as well as edited content for some of the investment industry’s biggest luminaries. Read more about Jim Woods.