Are Stocks about to Step on a Low-Volatility Land Mine?
If it seems like the action in the equity markets has been, well, a bit boring lately, then you’re not wrong.
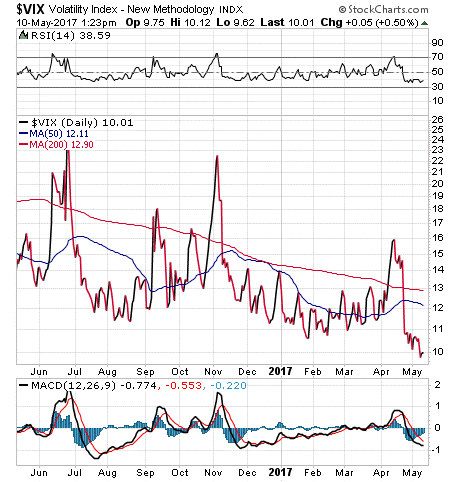
In fact, on Tuesday, markets hit the lowest level of volatility in some 23 years intraday, before climbing back up late in the session.
That reading is based on the CBOE Volatility Index, or $VIX, which also is known as the “fear index.” As you can see by the chart here, there’s not much fear in the market right now.
Yet the absence of fear reflected in the low VIX is, paradoxically, causing a lot of fear on Wall Street.
The reason why is because when the fear (i.e. complacency) level gets so low, the market sees that as having no way to go but up… and that means a likely period of volatile selling ahead for the major indices.
At least, that’s what a lot of Wall Street pundits have been saying is likely to happen.
Now, while this might be true theoretically (what comes down always goes up), the real question is: When will the VIX move higher, and how long can it stay at uber-low levels?
The answer to the first question requires something no human is equipped with, and that is the ability to see the future. However, the answer to the second question is the VIX can stay low for a very long time… and a lot longer than its current low-volatility run.
To get a bit more insight into this thesis, I turned to my friend and market-watcher extraordinaire Tom Essaye, editor of the Sevens Report (a must-read publication for any serious investor).
Here’s what Tom told me about this low-VIX situation:
“With a close at 9.98 yesterday, the VIX now is lower than nearly 99.5% of all the closes since Jan. 1, 1990. Put another way, it’s only closed this low about 0.05% of the time during the last 27-plus years. So, the VIX is extraordinarily low… but, that doesn’t mean it’s going to bounce back soon.”
Tom went on to explain that there have been two specific periods of similarly low volatility in the last 20 years. The first occurred in mid-2014 and lasted 75 days. The second was from November 2006 to March 2007, and that lasted 79 days. The current period of historically low volatility has been going on for 78 days (including yesterday).
“We’re not even close to the record for low volatility. In 1992/1993 and 1995/1996, we saw respective periods of ultra-low volatility last for 179 and 254 days, respectively. That’s double and triple what we’ve seen so far in 2017.”
The big takeaway from Tom, and me, is that while we’re clearly near the top of recent periods of low volatility, remember that in both instances volatility only gradually rose. Moreover, markets didn’t see significant pullbacks until months and quarters later.
So, if you get the urge to suddenly run out and sell stocks just because volatility is low, you’d be making a big mistake.
And while some big names are selling here (see the Gundlach section below), the lack of volatility leading to an impending sell-off is not a good reason to do so.
The bottom line is we are not yet dangerously close to stepping on a low-volatility land mine, so walk upright (though always cautiously) through the market battlefield.
If you want to find out how my subscribers are winning the war against mediocre market returns, then I invite you to check out my Successful ETF Investing newsletter today!
ETF Talk: This Early-Starter Bond Fund Guards against Inflation
By Eagle Staff
This week’s exchange-traded fund (ETF), the iShares TIPS Bond Exchange ETF (TIP), invests in U.S. Treasury Inflation Protected Securities (TIPS).
The TIPS are indexed to inflation to protect investors. TIPS are considered to be extremely low-risk because they are backed by the U.S. government and their value rises with inflation.
The fund typically invests 95% of its assets in U.S. government bonds. It also may invest up to 5% of its assets in repurchase agreements (Repos) collateralized by U.S. government obligations or otherwise hold the 5% in cash and cash equivalents.
Following its December 2003 inception, TIP had a roughly 3.5-year head start to build its asset base before ETFs started to really attract the attention of investors. TIP’s first-mover advantage has allowed it to accumulate $22.69 billion in total assets, as well as enjoy a massive average daily trading volume of $148.46 million. In addition to liquidity, TIP’s portfolio is broad and well-diversified.
From the chart below, you can see that the fund was hurt by the Trump rally in December, but has rebounded since then. The fund’s year-to-date return is 0.90% versus the S&P 500’s 7.11%. TIP’s total return since inception is 4.17%. TIP has a distribution yield of 3.03% and an expense ratio of 0.20%.
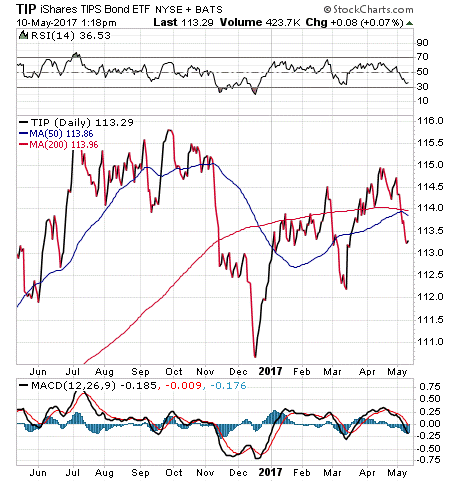
TIP’s top five holdings in the portfolio are U.S. Treasury Notes with various maturity dates: 7.94% Notes with a maturity date of 7/15/2024; 6.34% Notes with a maturity date of 4/15/2019; 4.94% Notes with a maturity date of 4/15/2021; 4.51% Notes with a maturity date of 1/15/2024; and 4.47% Notes with a maturity date of 4/15/2025.
If you are seeking exposure to U.S. Treasury bonds while steering clear of inflation risks, I encourage you to look into iShares TIPs Bond Exchange ETF (TIP) as a potential investment.
As always, we are happy to answer any of your questions about ETFs, so do not hesitate to send us an email. You just may see your question answered in a future ETF Talk.
3 ETFs to Play Gundlach’s Latest Big Recommendation
When Jeffrey Gundlach speaks, investors listen.
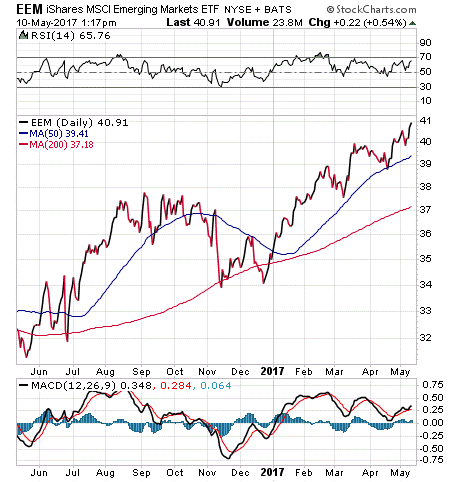
I’ve been listening to the DoubleLine Capital CEO/CIO for years, as he’s one of the smartest men on Wall Street. And after correctly predicting both a Donald Trump presidential victory and the subsequent post-election Trump equity rally, Gundlach is making a different call today… one that involves selling short the S&P 500 and buying emerging markets.
This “short home, long abroad” strategy was revealed this week by Gundlach at the Sohn Investment Conference in New York. The DoubleLine chief, also known as “The New Bond King,” recommends investors should short the S&P 500 Index via the SPDR S&P 500 ETF Trust (SPY) while also buying the iShares MSCI Emerging Markets ETF (EEM).
But even if you buy Gundlach’s theory, simply shorting SPY and buying EEM isn’t the only way — or even the best way — to do it.
Here are what I think are three better ways to use ETFs to play Gundlach’s latest big recommendation.
15 Things to Buy with Your Sell-in-May Profits
Life in the equity markets has been very good to investors, especially since the unexpected election of Donald Trump as our 45th president.
The S&P 500 is up more than 12% since Election Day, and many stocks are up far more than that since the “Trump reflation trade” has been in effect.
Now, however, we’re in May, and that means many investors are planning to follow one of Wall Street’s oldest adages: “Sell in May and go away.”
If you are sitting on a whole lot of post-election profits, and you are getting ready to sell in May and go away, the question then becomes… what do you buy with all that money?
Here’s a fun look at some of my favorite things to buy with your sell-in-May profits.
FBI Wisdom
“Just the minute the FBI begins making recommendations on what should be done with its information, it becomes a Gestapo.”
— J. Edgar Hoover
The big news in D.C. is the firing of FBI Director James Comey. And while this shouldn’t have a direct effect on markets, it does influence the mood in Washington. That mood needs to be at least congenial enough to get Republicans to agree on tax reform, as that is the one real positive capable of allowing stocks to continue to move higher.
Wisdom about money, investing and life can be found anywhere. If you have a good quote you’d like me to share with your fellow readers, send it to me, along with any comments, questions and suggestions you have about my audio podcast, newsletters, seminars or anything else. Click here to ask Jim.
In case you missed it, I encourage you to read my e-letter from last week about how the market largely ignored the past week’s Fed meeting.

Jim Woods is a 30-plus-year veteran of the markets with varied experience as a broker, hedge fund trader, financial writer, author and newsletter editor.
His books include co-authoring, “Billion Dollar Green: Profit from the Eco Revolution,” and “The Wealth Shield: How to Invest and Protect Your Money from Another Stock Market Crash, Financial Crisis or Global Economic Collapse.” He’s also ghostwritten many books and articles, as well as edited content for some of the investment industry’s biggest luminaries. Read more about Jim Woods.